Pinterest Analytics: Metrics That Change Your Next Move
Read Pinterest Analytics as a sequence, not a scoreboard. Impressions show visibility. Saves and pin clicks show kinds of interest. Outbound clicks show traffic intent. Your site analytics shows whether any of it was worth having.
Joe Nyambura
Founder & operator, Pinners Haven · August 18, 2026

On this page25 sections
- The core metrics, and what to ask of each
- The views that matter
- Performance over time
- Top pins and boards
- Audience Insights
- Diagnose patterns, not numbers
- Low impressions
- Impressions, few pin clicks
- Pin clicks, few outbound clicks
- Outbound clicks, weak site engagement
- Site engagement, no conversions
- A weekly review in 20 minutes
- A monthly content review
- Connecting Pinterest to conversions
- Metrics by goal
- The loop most people don't close
- Nine common analytics mistakes
- Frequently asked questions
- Is Pinterest Analytics free?
- Why did my numbers go down?
- What's a good outbound click rate?
- How often should I check?
- Does Analytics tell me the best time to post?
- Why don't Pinterest and Google Analytics agree?
- Turn every chart into a decision
Read Pinterest Analytics as a sequence, not a scoreboard. Impressions show visibility. Saves and pin clicks show kinds of interest. Outbound clicks show traffic intent. Your site analytics shows whether any of it was worth having.
Most people open the dashboard, look at the biggest number — impressions, and close it again no wiser. Impressions are the metric Pinterest shows first and the one that should change your behaviour least. A pin with 100,000 impressions and 12 outbound clicks isn't a success with a caveat; it's a design brief.
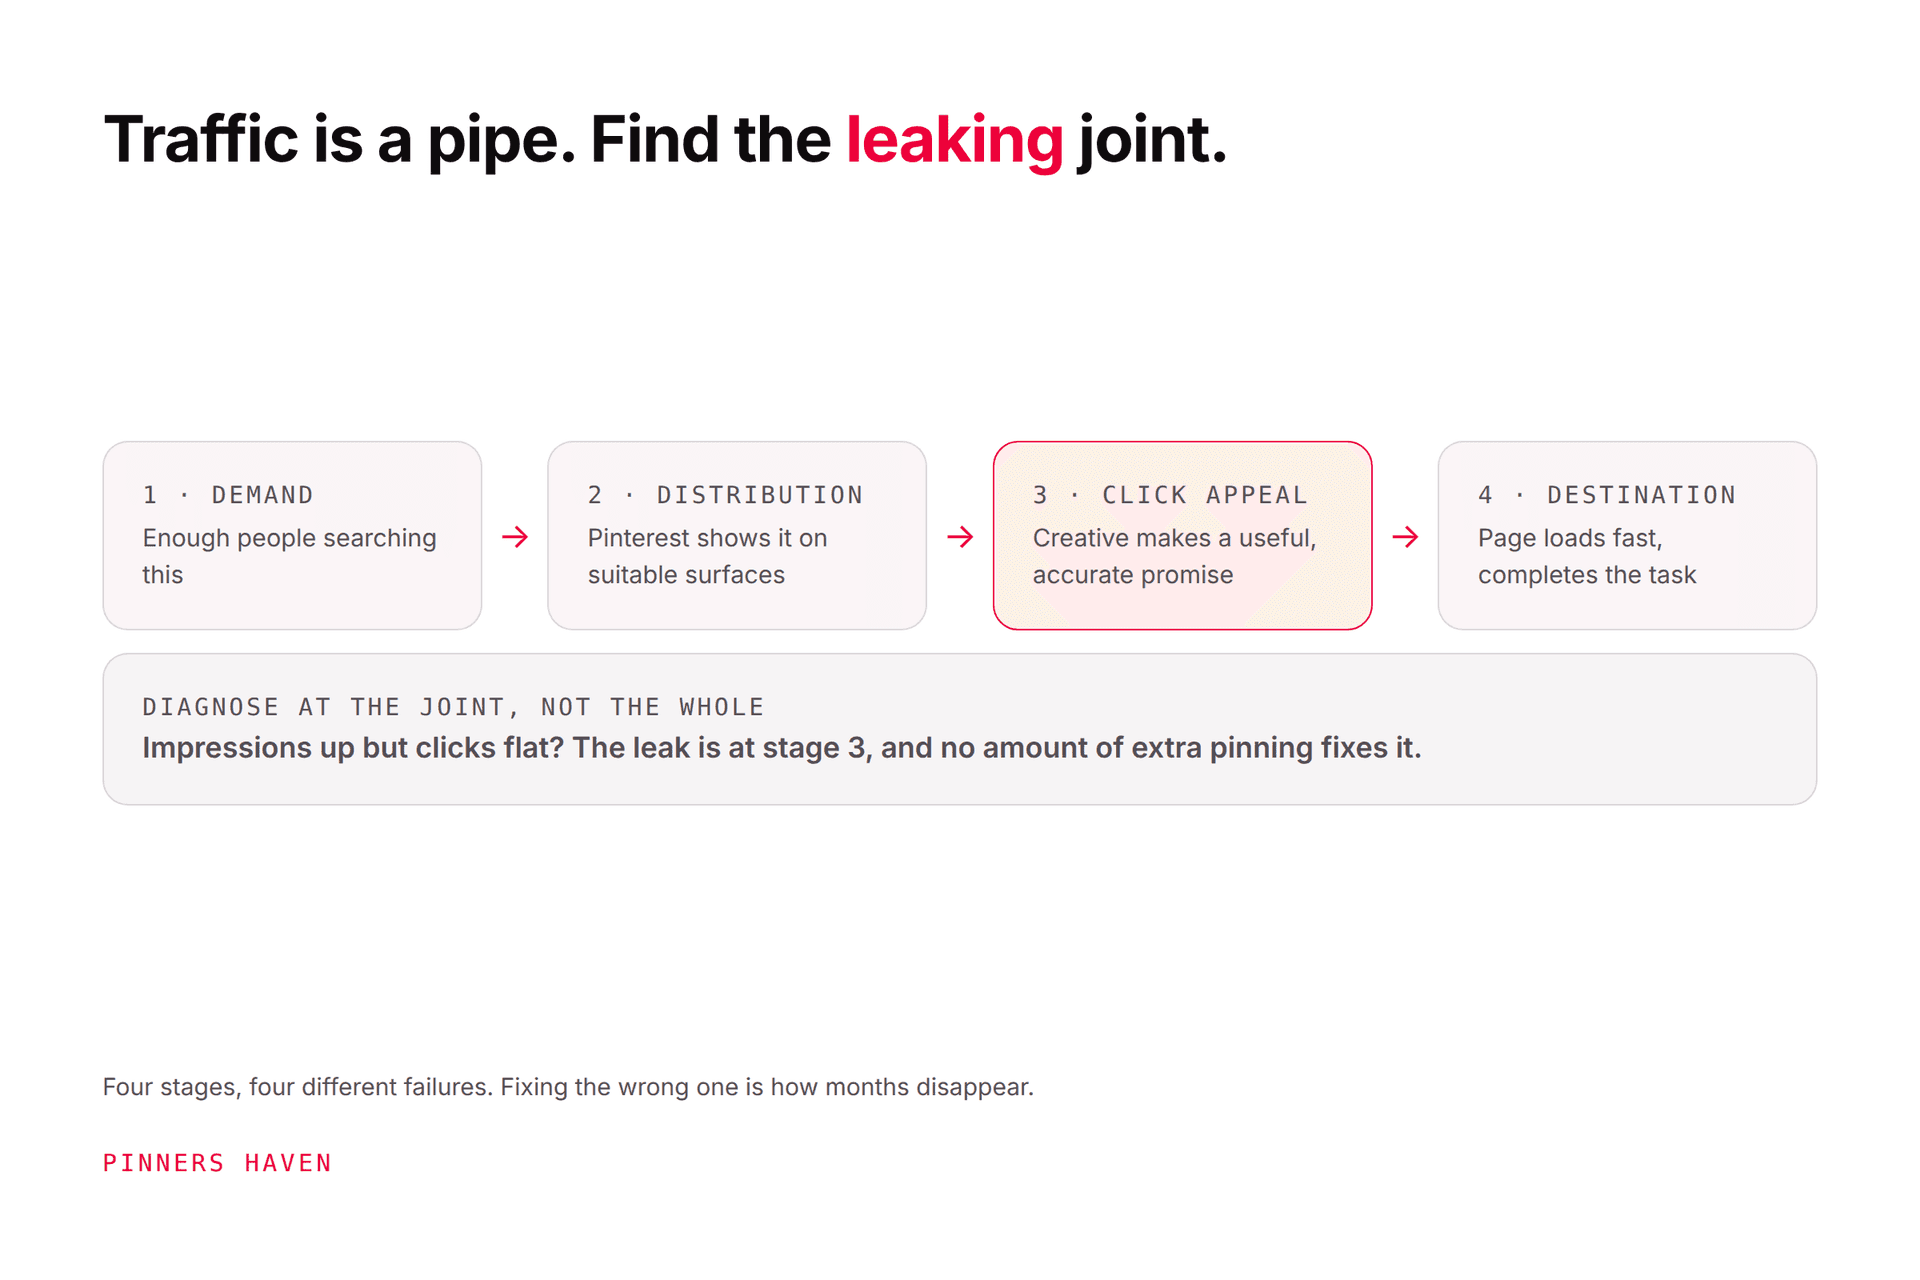
No single number tells the story. The sequence does, because where it breaks tells you exactly what to fix.
The core metrics, and what to ask of each
Pinterest Analytics gives an Overview with overall performance, performance over time, and top boards and pins.
Metric | What it indicates | The question it should prompt |
|---|---|---|
Impressions | Times a pin appeared on screen | Was it shown to the right audience? |
Saves | Times people saved it to a board | Does this have future or reference value? |
Pin clicks | Clicks opening the pin closeup | Did the creative earn deeper interest? |
Outbound clicks | Clicks leading away from Pinterest | Did it create a reason to visit? |
Engagements | Saves, clicks, swipes, other interactions | Which interaction supports the goal? |
Engagement rate | Engagements ÷ impressions | Is it connecting after distribution? |
Outbound click rate | Outbound clicks ÷ impressions | Is visibility becoming traffic? |
Don't compare unlike goals. A mood-board idea is supposed to earn saves. A product guide is supposed to earn outbound clicks. Judging one by the other's metric produces confident, wrong conclusions.

The views that matter
Performance over time
Use it for direction and seasonality. Pick a meaningful date range, then compare content types, formats, claimed accounts, devices, sources, or audience filters where available. Pinterest allows historical filters extending roughly 1.5 years, though views and filters vary by account.
Top pins and boards
This shows where results concentrate, and concentration is itself a finding. Sort by the metric tied to your business goal, not the default.
Check the destination as well as the pin. Strong performance quietly dies when a page goes stale, a product sells out, or a link breaks, and the chart won't tell you which.
Audience Insights
Audience Insights describes interests and demographics using search and save behaviour, across engaged audience, total audience, and a Pinterest comparison. Pinterest documents a 30-day view with desktop export.
Use affinities to generate hypotheses, not stereotypes. A strong affinity doesn't mean everyone in that group wants the same message.
Diagnose patterns, not numbers
Find your symptom:
Low impressions
Investigate topic demand, search language, seasonality, board relevance, creative quality, account health, and whether the pin has simply had enough time. Pinterest says there's no fixed engagement window.
Impressions, few pin clicks
The visual isn't stopping the scroll, the headline is generic, or it's surfacing to a broad audience. Test a clearer subject, stronger contrast, or a more specific promise.
Pin clicks, few outbound clicks
The closeup satisfied the curiosity, or the reason to leave isn't clear. Make the off-platform value explicit — without resorting to a misleading curiosity gap, which works once and costs you the reader.
Outbound clicks, weak site engagement
Check mobile speed, tracking, page stability, consent banners, and message match. Compare landing pages before blaming the channel — it's usually one page, not Pinterest.
Site engagement, no conversions
Offer, price, checkout, lead form, trust signals, or conversion tracking. Pinterest can't tell you why someone abandoned a difficult checkout, and no amount of pin optimisation will.
Our traffic guide has a repair plan for each stage.
A weekly review in 20 minutes
1. Check delivery and links. Did scheduled pins publish? Do destinations load? Are prices current? Any account notifications?
2. Compare the last complete period. Never use only the real-time 48-hour view — Pinterest says those are estimates that can decrease. Compare the last full seven days against a suitable prior period, and against the same seasonal window where you can.
3. Find three leaders. The top pin for impressions, for outbound clicks, and for your actual conversion. They're often three different pins, and that gap is the most useful thing in your weekly review.
4. Find one bottleneck. Weak distribution, weak click appeal, weak outbound intent, or weak landing-page results. One.
5. Assign one clean test. Change one major idea — visual concept, query intent, or landing-page offer. Record the start date.

A monthly content review
Export pin-level results and group by topic cluster, destination, creative concept, format, board, seasonal vs evergreen, and new vs updated page.
Then make one of four decisions per group:
Scale — build another distinct concept or a related destination
Improve — repair the identified weak stage
Maintain — update links and content without adding volume
Retire — stop promoting an inaccurate, unavailable, or off-strategy page
Don't delete a quiet pin because its first week was slow. Pinterest's distribution guidance says pins can gain engagement much later, so early silence is not a verdict.
Connecting Pinterest to conversions
Your website analytics should record landing sessions and business outcomes. Use consistent campaign naming if you add tracking parameters, and document where platform attribution differs.
For eligible setups, Conversion Insights combines organic and paid conversion reporting. Note Pinterest's own caveat: attribution uses the last interacted pin, which doesn't necessarily mean the person bought the item shown.
Treat attribution as a model, not a replay. Pinterest reporting and your store records will disagree, and expecting them to match exactly wastes a great deal of time.
Metrics by goal
Blog traffic — outbound clicks, outbound click rate, engaged sessions, signups. If distribution is consistently weak, start with Pinterest SEO.
Ecommerce — outbound clicks, product views, add-to-cart, checkout starts, purchases, revenue, margin. Keep catalog price and availability current; a perfect pin for an out-of-stock item is worse than none.
Brand discovery — qualified impressions, saves, video completion, branded search, direct site behaviour. Define "qualified" by topic and audience context, or the number is meaningless.
Publishing efficiency — approved pins, error rate, brief-to-publish time, results per destination. Output count rewards activity, not impact.
The loop most people don't close
Look at the weekly and monthly reviews above and be honest about which parts survive contact with a busy month.
Step 3 — identifying which pins earn saves and outbound clicks, then deliberately making more like them — is where all the compounding lives, and it's the first thing to go. Doing it by hand across a few hundred pins means a spreadsheet nobody updates past week three. So people default to optimising impressions, because impressions are the number that's already on the screen.
Pinners Haven closes that loop automatically: it measures saves and outbound clicks per pin rather than impressions, and biases new generation toward the angles and designs actually earning them, so results build instead of restarting. It also watches reach week over week and emails you when an account falls off a cliff at a threshold you set, which is the weekly delivery check in step 1, running without you.
It doesn't replace this article. You still decide what "qualified" means and whether a destination deserves traffic.
→ Start a 14-day trial — from $19/mo billed annually. No card needed; when the trial ends, publishing pauses until you pick a plan.
(Disclosure: we make Pinners Haven. We're not affiliated with Pinterest.)
Nine common analytics mistakes
optimising every pin for impressions
combining all countries, devices, and formats without checking the mix
judging from incomplete real-time data
ignoring seasonality
comparing a new account against a mature competitor
changing strategy after one unusual day
failing to annotate site, policy, or tracking changes
expecting Pinterest and site attribution to match exactly
scaling a pin before checking its destination
Frequently asked questions
Is Pinterest Analytics free?
Yes, for business accounts. Converting from personal is free and keeps your pins and followers — see the business account guide.
Why did my numbers go down?
The most recent 48 hours are estimates and can be revised downward — that's normal and not a problem. Longer-term declines reflect seasonality, filters, content performance, account changes, or measurement updates. Work the impressions-drop checklist.
What's a good outbound click rate?
There's no universal benchmark that survives differences in niche, format, country, and intent — anyone quoting one is guessing. Build a baseline from your own comparable content and improve against that.
How often should I check?
A short weekly operational check and a deeper monthly review. Checking daily produces anxiety and worse decisions, because you're reading noise.
Does Analytics tell me the best time to post?
It helps you compare your own account's patterns, but Pinterest discovery continues long after publication, so timing is one variable rather than a lever. See the posting-time guide.
Why don't Pinterest and Google Analytics agree?
Different attribution models, different session definitions, consent tooling, and redirect handling. They will never match exactly. Pick one as your source of truth for decisions and use the other for direction.
Turn every chart into a decision
Before you close Analytics, write one sentence:
"Because we observed X, we will test Y for Z period."
If you can't complete that sentence, you were browsing, not analysing. And if a metric never appears in one of those sentences, it doesn't deserve a prominent place in your report.